How Pinterest Rebuilt their Logging Stack
Plus, a dive into Load Shedding, AWS's Anti-Competitive Pricing Strategy, How to write an Engineering Strategy and more.
Hey Everyone!
Today we’ll be talking about
How Pinterest Rebuilt their Logging Stack
The Three Pillars of Observability
Pinterest’s Goals for the Logging System
Using OpenSearch, Kafka, Apache Hive and more
Final Use Cases and Results for the new Logging System
Tech Snippets
A Dive Into Load Shedding - Amazon Builders Library
How to Write an Engineering Strategy
Build Your Own Redis in C
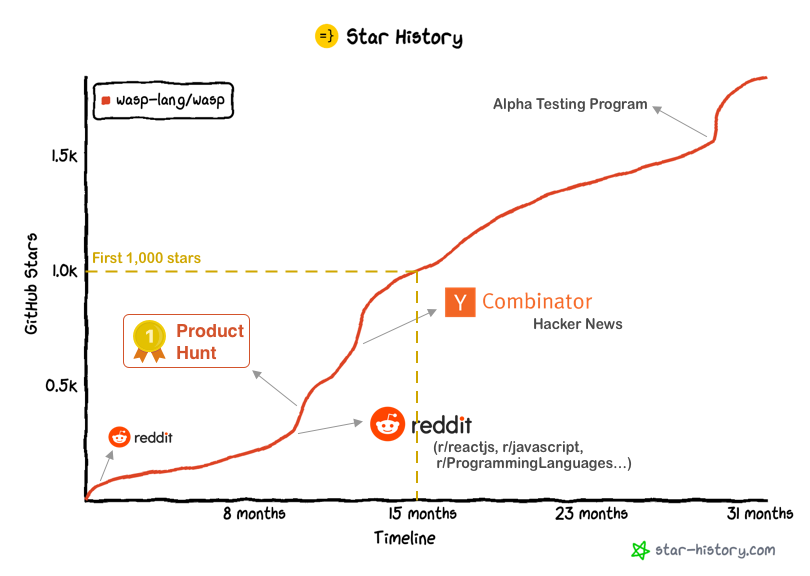
How Wasp Reached 1,000 Stars on Github
AWS’s Anti-Competitive Pricing Strategy
The Architecture of Pinterest’s Logging System
Backend systems have become incredibly complicated. With the rise of cloud-native architectures, you’re seeing microservices, containers and container orchestration, serverless functions, polyglot persistence (using multiple different databases) and a dozen other buzzwords.
Many times, the hardest thing about debugging has become figuring out where in your system the code with the problem is located.
Roblox (a 30 billion dollar company with thousands of employees) had a 3 day outage in 2021 that led to a nearly $2 billion drop in market cap. The first 64 hours of the 73 hour outage was them trying to figure out the underlying cause. You can read the full post mortem here.
In order to have a good MTTR (recovery time), it’s crucial to have solid tooling around observability so that you can quickly identify the cause of a bug and work on pushing a solution.
In this article, we’ll give a brief overview of Observability and talk about how Pinterest rebuilt part of their stack.
Three Pillars of Observability
Logs, Metrics and Traces are commonly referred to as the “Three Pillars of Observability”. We’ll quickly break down each one.
Logs
Logs are time stamped records of discrete events/messages that are generated by the various applications, services and components in your system.
They’re meant to provide a qualitative view of the backend’s behavior and can typically be split into
Application Logs - Messages logged by your server code, databases, etc.
System Logs - Generated by systems-level components like the operating system, disk errors, hardware devices, etc.
Network Logs - Generated by routers, load balancers, firewalls, etc. They provide information about network activity like packet drops, connection status, traffic flow and more.
Logs are commonly in plaintext, but they can also be in a structured format like JSON. They’ll be stored in a database like Elasticsearch
The issue with just using logs is that they can be extremely noisy and it’s hard to extrapolate any higher-level meaning of the state of your system out of the logs.
Incorporating metrics into your toolkit helps you solve this.
Metrics
Metrics provide a quantitative view of your backend around factors like response times, error rates, throughput, resource utilization and more. They’re commonly stored in a time series database.
They’re amenable to statistical modeling and prediction. Calculating averages, percentiles, correlation and more with metrics make them particularly useful for understanding the behavior of your system over some period of time.
The shortcoming of both metrics and logs is that they’re scoped to an individual component/system. If you want to figure out what happened across your entire system during the lifetime of a request that traversed multiple services/components, you’ll have to do some additional work (joining together logs/metrics from multiple components).
This is where Distributed Tracing comes in.
Tracing
Distributed traces allow you to track and understand how a single request flows through multiple components/services in your system.
To implement this, you identify specific points in your backend where you have some fork in execution flow or a hop across network/process boundaries. This can be a call to another microservice, a database query, a cache lookup, etc.
Then, you assign each request that comes into your system a UUID (unique ID) so you can keep track of it. You add instrumentation to each of these specific points in your backend so you can track when the request enters/leaves (the OpenTelemetry project calls this Context Propagation).
You can analyze this data with an open source system like Jaeger or Zipkin.
If you’d like to learn more about implementing Traces, you can read about how DoorDash used OpenTelemetry here.
Logging at Pinterest
Building out each part of your Observability stack can be a challenge, especially if you’re working at a massive scale.
Pinterest recently published a blog post delving into how their Logging System works.
Here’s a summary
In 2020, Pinterest had a critical incident with their iOS app that spiked the number of out-of-memory crashes users were experiencing. While debugging this, they realized they didn’t have enough visibility into how the app was running nor a good system for monitoring and troubleshooting.
They decided to overhaul their logging system and create an end-to-end pipeline with the following characteristics
Flexibility - the logging payload will just be key-value pairs, so it’s flexible and easy to use.
Easy to Query and Visualize - It’s integrated with OpenSearch (Amazon’s fork of Elasticsearch and Kibana) for real time visualization and querying.
Real Time - They made it easy to set up real-time alerting with custom metrics based on the logs.
Here’s the architecture
The logging payload is key-value pairs sent to Pinterest’s Logservice. The JSON messages are passed to Singer, a logging agent that Pinterest built for uploading data to Kafka (it can be extended to support other storage systems).
They’re stored in a Kafka topic and a variety of analytics services at Pinterest can subscribe to consume the data.
Pinterest built a data persisting service called Merced to move data from Kafka to AWS S3. From there, developers can write SQL queries to access that data using Apache Hive (a data warehouse tool that lets you write SQL queries to access data you store on a data lake like S3 or HDFS).
Logstash also ingests data from Kafka and sends it to AWS OpenSearch, Amazon’s offering for the ELK stack.
Pinterest developers now use this pipeline for
Client Visibility - Get insights on app performance with metrics around networking, crashes and more.
Developer Logs - Gain visibility on the codebase and measure things like how often a certain code path is run in the app. Also, it helps troubleshoot odd bugs that are hard to reproduce locally.
Real Time Alerting - Real time alerting if there’s any issues with certain products/features in the app.
And more.
For more details, read the full blog post here.
How did you like this summary?Your feedback really helps me improve curation for future emails. |
A huge part of your compensation in Big Tech is equity, vested over 4 years. This means picking the right company to join can make a difference of tens of thousands of dollars.
But how do you know about what FAANG companies are investing in?
Patent Drop is a new newsletter that scans hundreds of patent filings to send you analysis on the inside scoop of exactly what each Big Tech company is planning.
You’ll get info on Google’s patents around generative AI models, Meta’s research on VR headset pass-through tech, Amazon’s latest filing on voice recognition and more.
It’s completely free and read by over 18,000 developers, product managers, and more.
Tech Snippets


Quastor Pro
In addition to our emails, you can also get weekly articles on system design and technical dives on cool tech!
Past articles include
System Design Articles
Tech Dives
Database Concepts
It’s $12 per month and I’d highly recommend using your job’s Learning & Development stipend to pay for it!