How Canva Redesigned their Attribution System
We'll talk about why Canva switched to an ELT system built with Snowflake and DBT. Plus, how an empty S3 bucket can make your AWS bill explode, How Figma cut their C++ build times and more.
Arpan KG
May 01, 2024
Hey Everyone!
Today we’ll be talking about
How Canva Redesigned their Attribution System
Canva’s initial system with MySQL and worker processes
ETL (extract-transform-load) versus ELT (extract-load-transform)
An introduction to Snowflake and “Modern Data Warehouses”
Canva’s new architecture with ELT, Snowflake and DBT
Tech Snippets
How an empty S3 bucket can make your AWS bill explode
How Figma cut their C++ build times by 50%
Quality Assurance at Microsoft
How to Raise the Alarm for a Doomed Project
How Canva Redesigned their Attribution System
Canva is a graphics design platform that lets you create professional-looking social media images, posters, videos and more. They have a user-friendly UI and an extensive library of pre-built templates, videos, images, fonts and more. It’s pretty useful if you’re someone like me and have the visual-design skills of a 10 year old.
The pre-built graphics in their library are made by other users on the website through Canva’s Creator program.
If you’re a graphic designer looking for some side-income, then you can join their Creator program and contribute your own graphics. If another user uses your video/image then you’ll get paid by Canva.
This program has been massive for helping Canva have more pre-built graphics available on their platform. Since the program launched 3 years ago, the usage of pre-built content has been doubling every 18 months.
However, attribution is a key challenge the Canva team needs to handle with the Creator program. They have to properly track what pre-built assets are being used and make sure that the original creators are getting paid.
Some of the core design goals for this Attribution system are
Accuracy - the usage counts should never be wrong. Any incidents with over/under-counting views should be minimized.
Scalability - usage for Canva templates is growing exponentially, so the system needs to scale with the volume
Operability - as usage grows, operational complexity of maintenance, incident handling and recovery should be manageable.
Initially, the Canva team used MySQL to store this data with separate worker processes to crunch the usage numbers for all the pre-built graphics. However, they ran into a ton of issues with this approach.
After considering some alternatives, they decided to switch to Snowflake and use DBT for the data transformations.
They wrote a terrific blog post on their process.
We’ll first talk about their initial system with MySQL and worker processes (and the issues they faced). Then, we’ll delve into the design of the new system with Snowflake.
We’ll cover a ton of concepts on ETL/ELT, Snowflake, Modern Data Warehouses and more.
If you’d like Spaced Repetition Flashcards (Anki) on all the concepts discussed in Quastor, check out Quastor Pro.
When you join, you’ll also get an up-to-date PDF with all our past articles.
Initial Design with MySQL
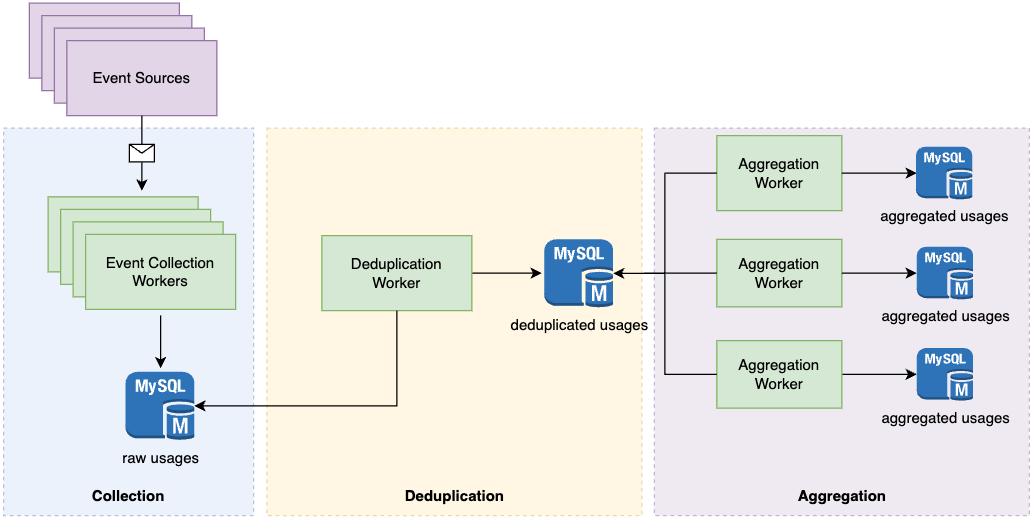
Canva’s initial design relied on three main steps
Collection - Event Collection workers would gather data from web browsers, mobile app users, etc. on how many interactions there were with pre-built content. This raw usage data would get stored in MySQL.
Deduplication - Deduplication worker nodes would read the raw content-usage data from MySQL and scan the data for any duplicates to ensure that each unique usage was only counted once. They’d write the transformed usage data back to MySQL.
Aggregation - Aggregation workers would read the deduplicated usage data and then aggregate the counts based on different criteria (usage counts per template, usage counts per user, etc.).
As Canva’s system scaled, this design led to several scaling issues.
Processing Scalability - For processes like the deduplication scan, the total number of database queries was growing linearly with the number of content-usage records. This was overwhelming MySQL.
Storage Consumption - the data they needed to store quickly grew and they started facing issues when their MySQL instances reached several terabytes.
Canva used AWS RDS for their MySQL databases and they found that the engineering efforts were significantly more than they initially expected. They were vertically scaling (doubling the size of the RDS instance) but found that upgrades, migrations and backups were becoming more complex and risky.Incident Handling - Canva was running into issues with over/under-counting and misclassified usage events. This meant that engineers had to look into databases to fix the broken data. In times of high volume (or due to a bug), there would be processing delays in handling the new content-usage data.
To address these issues, Canva decided to pivot to a new design with ELT, Snowflake and DBT.
ELT System with Snowflake
For the new architecture, the Canva team decided to combine the various steps in deduplication and aggregation into one, unified pipeline.
Rather than using different worker processes to transform the data, they decided to use an Extract-Load-Transform approach.
ETL vs ELT
Two popular frameworks for building data processing architectures are Extract-Transform-Load (ETL) and Extract-Load-Transform (ELT).
ETL has been the traditional approach with data warehousing where you extract data from the sources, transform the data in your data pipelines (clean and aggregate it) and then load it into your data warehouse.
A newer paradigm is ELT, where you extract the raw, unstructured data and load it in your data warehouse. Then, you run the transform step on the data in the data warehouse. With this approach, you can have more flexibility in how you do your data transformations compared to using data pipelines.
In order to effectively do ELT, you need to use a “modern data warehouse” that can ingest unstructured data and run complex queries and aggregations to clean and transform it.
Snowflake
Snowflake is a database that was first launched in 2014. Since its launch, it’s grown incredibly quickly and is now the most popular cloud data warehouse on the market.
It can be used as both a data lake (holds raw, unstructured data) and a data warehouse (structured data that you can query) so it’s extremely popular with ELT.
You extract and load all your raw, unstructured data onto Snowflake and then you can run the transformations on the database itself.
Some of the core selling points of Snowflake are
Separation of Storage and Compute - When Snowflake launched, AWS Redshift was the leading cloud data warehouse. With Redshift’s architecture, compute and storage were tightly coupled. If you wanted to run more intensive computations on your dataset, you couldn’t just scale up your compute; you had to increase both (this changed in 2020 with the introduction of Redshift RA3 nodes).
On the other hand, Snowflake gives fine-grained control over each, so you could have a small dataset but run extremely compute-heavy aggregations and queries (without paying for a bunch of storage you don’t need).
Multi-cloud - Another selling point built into the design of Snowflake is their multi-cloud functionality. They initially developed and launched on AWS, but quickly expanded to Azure and Google Cloud.
This gives you more flexibility and also helps mitigate vendor lock-in risk. It also reduces data egress fees since you don’t have to pay egress fees for transfers within the same cloud provider and region.
Other Usability Features - Snowflake has a ton of other features like great support for unstructured/semi-structured data, detailed documentation, extensive SQL support and more.
Architecture
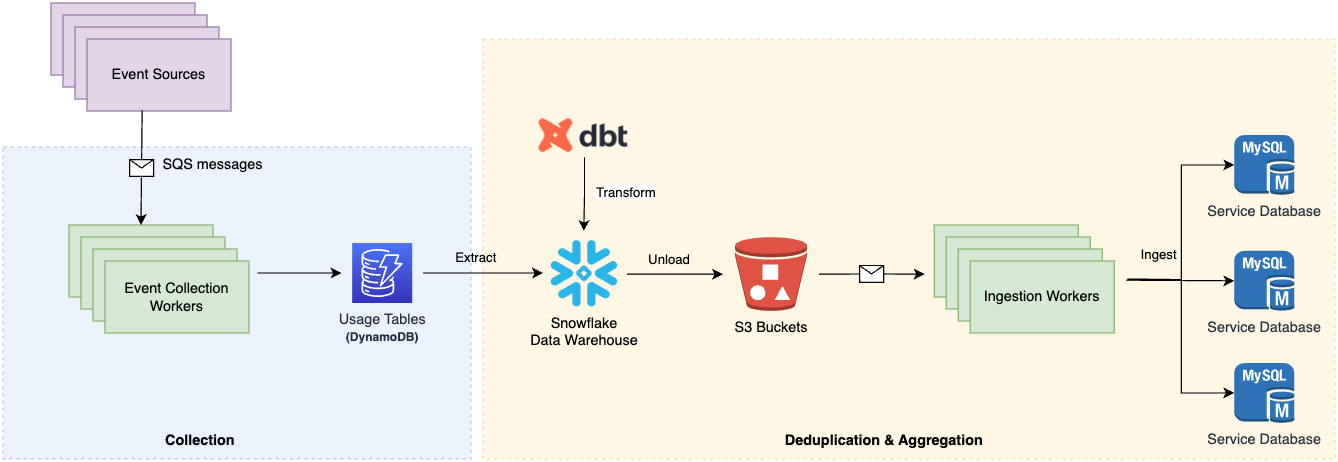
With the new architecture, the Event Collection workers ingest graphics usage events from the various sources and write this to DynamoDB (Canva made a switch from MySQL to DynamoDB that they discuss here).
The data is then extracted from DynamoDB and loaded into Snowflake. Canva then performs the transform step of ELT on Snowflake by using a series of transformations and aggregations (written as SQL queries with DBT).
The major steps are
Extract the DynamoDB JSON data into structured SQL tables
Deduplicate usage events based on predefined rules and filters
Aggregate usage events using GROUP BY queries
Results
Here’s some of the results from the new system
Reduced Latency - the entire pipeline’s latency went from over a day to under an hour.
More Scalability - Snowflake separates storage and compute so Canva can easily adjust either as their needs evolve.
Simplified Data and Codebase - with the simpler architecture, they eliminated thousands of lines of deduplication and aggregation-calculation code by moving this logic to Snowflake and DBT.
Fewer Incidents - Over/under-counting and misclassification still happen but Canva can fix most of that by re-running the pipeline end-to-end. There’s far less human involvement.